Place Matters, Community Matters
We know that where you live has an impact on your opportunity to live a long and healthy life, but this has little to do with where the pin drops on the map. Rather, it is the contours of each neighborhood–it’s DNA– that influences health. Every community has strengths, even those facing the most challenges. The Health Opportunity Index is designed to help residents identify which of the factors are supporting health opportunity in their communities and which may be holding them back. Our main dashboards allow communities to examine the HOI’s broad profiles–the chromosomes–that influence health. Our Profile dashboards dive deeper into the profiles and allow communities to examine indicators factors–the genes–that may affect the opportunity to live a long and health life in each community.
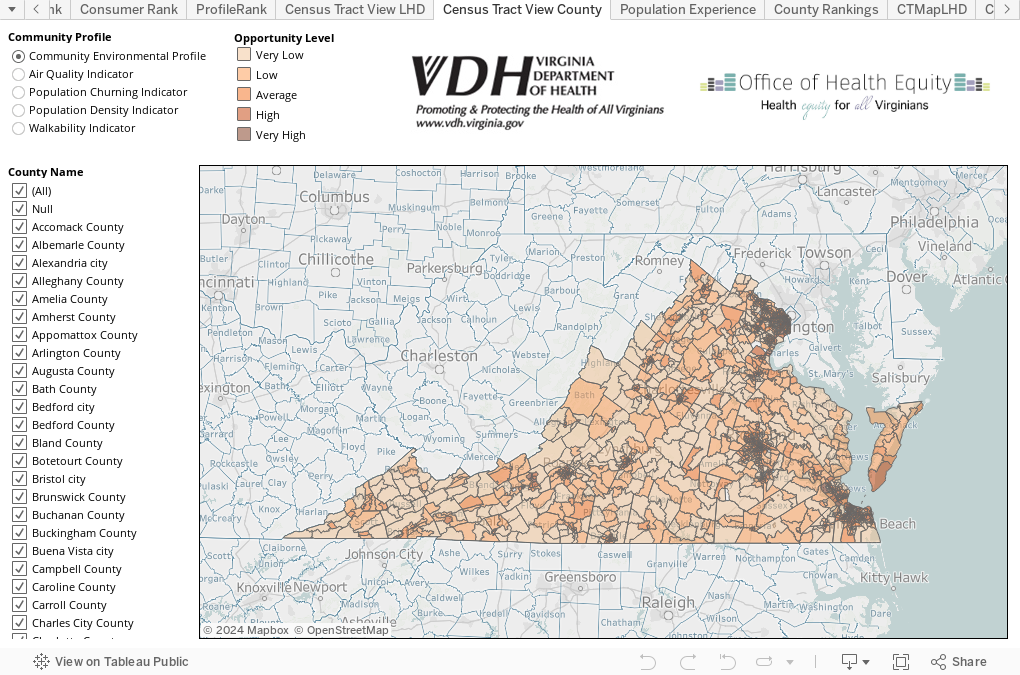
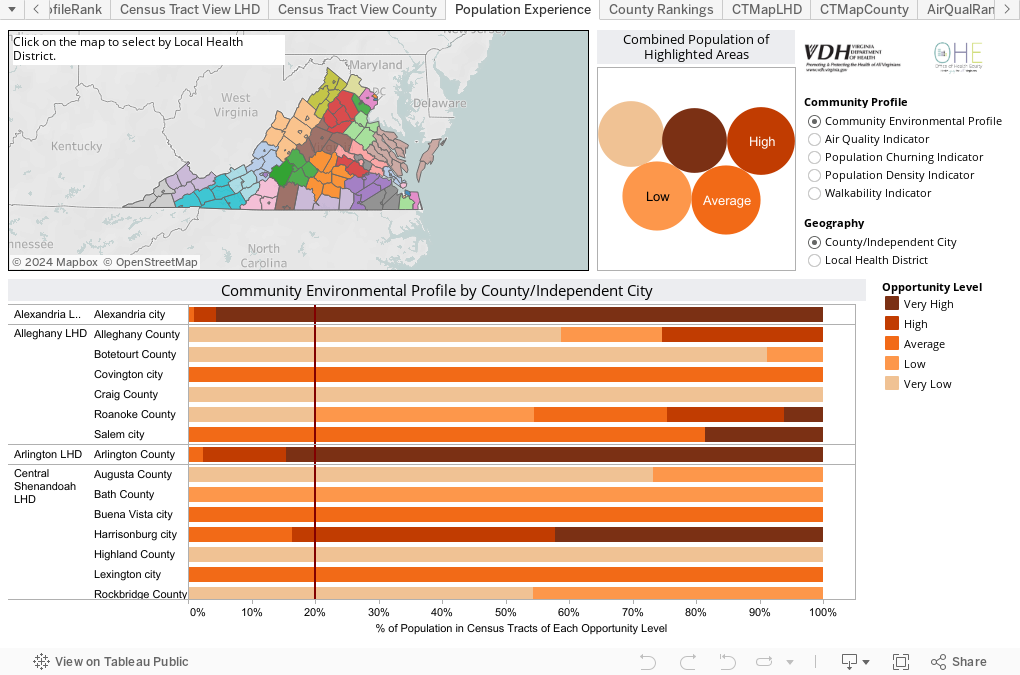
The Community Environmental Profile
The Community Environmental Profile examines the natural, built and social environment of a community. If you look closely at the map portion you may note a pattern: the Community Environmental Profile largely captures differences between rural, suburban and urban areas of Virginia. Health disparities between rural and urban populations have long been an issue (see the Rural Health Information Hub). However, the differences in the natural and built environment are not as uniform as we often expect. The dashboards below allow you to explore your community in detail on the following factors included in the Community Environmental Profile:
1. Air Quality Indicator: Includes EPA measures of pollution, including on-road, non-road and non-point pollution, and EPA measures of neurological, cancer and respiration risk.
2. Population Churning Indicator: The amount of population turnover within a community. It measure the rate at which people both move into a community and move out of a community.
3. Population Density Indicator: A measure of population density that takes into account the density levels most people in the community experience.
4. Walkability Indicator: A measure of how walkable a community is based on residential and employment density, land use (destination) diversity, street connectivity and public transit accessibility.
Use the dashboards below to explore the Community Environmental Profile and its indicators in your area.
A Closer Look
Health opportunity varies broadly across Virginia. It also varies significantly block by block and street by street within local health districts. Use the map below to examine the Community Environmental Profile at the Census Tract level in your community. Census Tracts are statistical areas created by the US Census Bureau that roughly equate to neighborhoods or groups of neighborhoods with similar characteristics.